
Subscribe to the
Lumen newsletter.
Sign up to receive $25 off along with the latest insights about metabolic health.
Thanks for subscribing!
As a special thank you, save $20 on your order by using
20ME.
RESEARCH
Dr. Kent A. Lorenz 1, Dr. Shlomo Yeshurun 2, Richard Aziz 1, Julissa Ortiz-Delatorre 1, Dr. James R. Bagley 1, Dr. Merav Mor 2, Dr. Marialice Kern 1
To evaluate the validity of a novel hand-held device (Lumen®) for measuring metabolic fuel utilization in healthy young adults.
Metabolic carts measure the carbon dioxide produced and oxygen consumed from the breath in order to assess metabolic fuel usage (carbohydrates vs. fats). However, these systems are expensive, time-consuming, and only available in the clinic. A small hand-held device capable of measuring metabolic fuel via CO2 was developed.
Metabolic fuel usage was assessed in healthy participants (n = 33; age: 23.1 ± 3.9 y) via respiratory exchange ratio (RER) values from the “gold-standard” metabolic cart as well as %CO2 from the Lumen device. Measurements were performed at rest in two conditions, fasting, and after consuming 150 grams of glucose in order to determine changes in metabolic fuel. Major axis regression was performed as well as Bland-Altman plots and linear regressions to test for agreement between RER and Lumen %CO2.
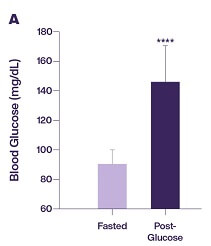
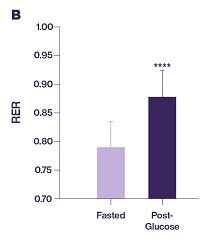
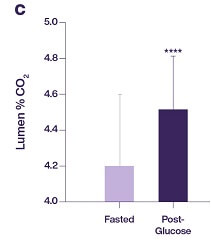
Paired t-test shows a significant increase for both Lumen %CO2 and the metabolic cart in response to glucose intake.
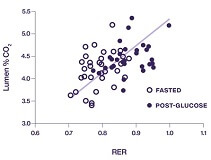
Major axis regression and Balnd-Altamn plot show an agreement between Lumen %CO2 and the metabolic cart RER in two metabolic states
In summary, Lumen® can provide valid information regarding an individual’s metabolic state. This corresponds with results from metabolic cart, but unlike the metabolic cart, can be performed anywhere and by anyone, without the need for a special clinic, equipment, and technicians. Lastly, the capability of taking these measurements continuously, can provide numerous insights about the metabolic state of an individual, as well the additional valuable information for our scientific knowledge about metabolic flexibility and nutrition.
RESEARCH
Michal Tal Mor, PhD, Merav Mor, PhD
Metabolic fuel is a well-known parameter which indicates the body’s fuel preference in energy production. Respiratory Quotient (RQ) is the gold standard measurement for directly determining metabolic fuel usage. However, because this method is invasive, and requires taking a blood sample, it renders the RQ measurement unfeasible and inaccessible in many cases. Respiratory Exchange Ratio (RER) is currently the preferred method for determining metabolic fuel usage. RER calculates the relative contribution of carbohydrate and lipids to overall energy expenditure, by measuring carbon dioxide production and oxygen uptake, in an indirect manner. The well-documented physiological range for the overall RER of an average individual is between 0.67 to 1.3; 0.70 for fats, 0.8 for proteins and 1.00 for carbohydrates. Measuring RER with the Metabolic Cart method is time-consuming (can take up to 40 minutes) and is only available in special clinics as it requires professional technicians for both administering the test and interpreting the system’s output. As a result, the process is very cumbersome and expensive. MetaFlow Ltd. (Lumen), an Israeli-based company founded in 2014, developed the Lumen device, a novel metabolic fuel breathalyzer that measures metabolic status in real-time.
Compare estimated changes in metabolic fuel usage using Lumen versus the gold standard metabolic cart method. In addition, identify changes in metabolic fuel usage following exercise, a change in diet, and a high-carb meal.
Three studies were conducted in two separate and independent institutes (Institution 1 and Institution 2). A total of 54 healthy subjects arrived at the clinic after fasting for 12 hours. Their RER was measured using metabolic cart gold standard devices (ParvoMedics TrueOne 2400 and Quark RMR, Cosmed) and the Lumen device. Next, they drank a high-carb shake and both measurements were taken again after 90 min and again after 180 min.
In the third study (Institution 2, 2018), Lumen was tested before and after measurements were taken with the metabolic cart, for test-retest reliability.
In addition, on day 4 subjects were measured 90 mins after a high-carb meal.
20 healthy subjects performed a running exercise at a maximum HR of 70 bpm for 60 mins. Measurements were taken using Lumen before and after the activity at a resting HR.
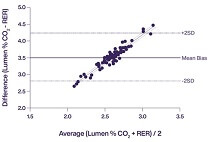
In all three validation studies, Lumen Index exhibited comparable results to gold standard RER. Bland-Altman plots showed that 95% of data points were within agreement range of 2SD, determining Lumen Index shows similar measurement of gold-standard metabolic cart (Figure 1).
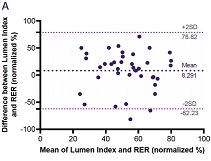
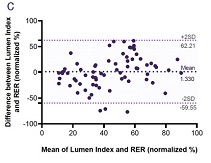

Figure 1.
Bland-Altman plots of the three validation studies: (A) Institution 1, 2017; n=39 (B) Institution 2, 2017; n=54 (C) Institution 2, 2018; n=69. Solid line represents the mean bias between the two measures and dotted lines represent ± 2 standard deviations from the mean (limits of agreement).
In all three validation studies, ANOVA of repetitive measurements showed Lumen Index to effectively differentiate between the different metabolic states of an individual following a high-carb meal (P < 0.0001 in all three studies; Figure 2). Tukey’s post hoc analysis revealed significant increase 90 min (P = 0.0001, P < 0.0001, P < 0.0001), and 180 min (P = 0.0032, P = 0.0101, P = 0.0067) after high-carb meal. Moreover, changes in Lumen Index in response to diet corresponded to changes exhibited in gold-standard RER (RM-ANOVA: P < 0.0001 in all three studies). Tukey’s post hoc analysis revealed significant increase 90 min (P < 0.0001, P < 0.0001, P < 0.0001), and 180 (P = 0.0111, P < 0.0001, P< 0.0001) min following a high-carb meal.

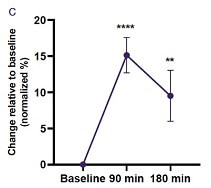

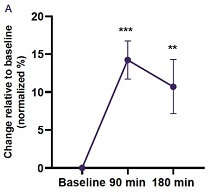
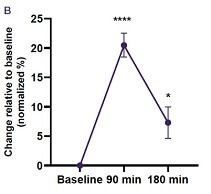
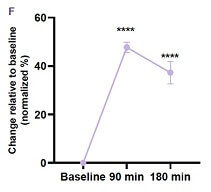
Figure 2.
(A) Lumen Institution 1, 2017; n=13. (B) Lumen Institution 2, 2017; n=18. (C) Lumen Institution 2, 2018; n=23. (D) RER Institution 1, 2017; n=13. (E) RER Institution 2, 2017; n=18. (F) RER Institution 2, 2018; n=23. Dots represent mean ± SEM. *P<0.05, **P<0.01, ***P<0.001, ****P<0.0001.
In addition, these changes from baseline were correlated between Lumen Index and gold-standard RER (Pearson: P = 0.0007, P < 0.0001, P = 0.0041; Figure 3).
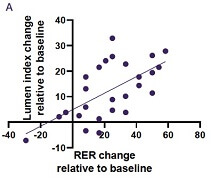
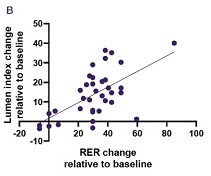
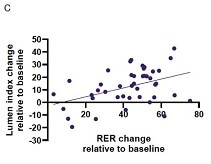
Figure 3.
A) Institution 1, 2017: Pearson r = 0.6211, p = 0.0007, Y = 0.3240*X + 4.848 (B) Institution 2, 2017: Pearson r = 0.6112, p < 0.0001, Y = 0.3979*X + 1.673 (C) Institution 2, 2018: Pearson r = 0.4295, p = 0.0041, Y = 0.3516*X - 2.616.
Lumen showed high test-retest reliability when measured before and after the metabolic cart. Percentage of CO2 levels measured by Lumen were highly correlated in all three timepoints, indicating the repeatability of Lumen (P < 0.0001 in all three states; Figure 4).
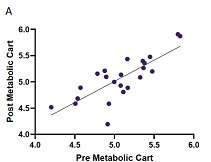
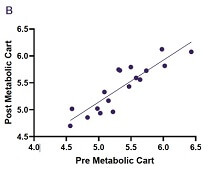
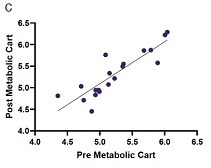
Figure 4.
(A) Lumen %CO2 after fasting: Pearson r = 0.7842, p < 0.0001, Y = 0.8059*X + 0.9804 (B) Lumen %CO2 90 min post high-carb meal: Pearson r = 0.8851, p < 0.0001, Y = 0.7798*X + 1.243 (C) Lumen %CO2 180 min post high-carb meal: Pearson r = 0.8740, p < 0.0001, Y = 0.9723*X + 0.2306
In an ANOVA repetitive measurements Lumen Index was found to effectively differentiate between the different metabolic states of an individual following a low and high carb diet (P = 0.0004; Figure 5A). Tukey’s post hoc analysis revealed significant reduction of 36% following a low-carb diet (P = 0.0013), which later increased by 37% following a high-carb diet (P = 0.0009). Moreover, changes in Lumen Index in response to diet corresponded to changes in weight (RM-ANOVA: P < 0.0001; Figure 5B), which were also reduced following a low-carb diet (P < 0.0001), and increased following a high-carb diet (P = 0.0041).
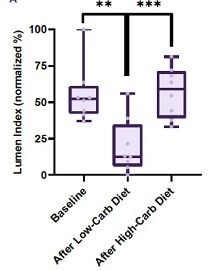
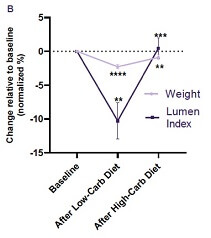
Figure 5.
A) Distribution of Lumen index change following low and high carb diets. Box plot whiskers represent minimum and maximum. (B) Changes in the Lumen index and weight following low and high carb diets. Dots represent mean ± SEM. **P<0.01, ***P<0.001, ****P<0.0001. n=8
In a t-test analysis, Lumen index was found to effectively differentiate between the different metabolic states of an individual following a high-carb meal (P < 0.0001; Figure 6).
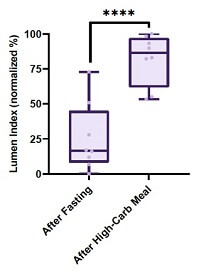
Figure 6.
Distribution of Lumen index change following high-carb meal. Box plot whiskers represent minimum and maximum. ****P<0.0001. n=8.
Lumen Index decreased in 16 out of 20 subjects following physical activity (80%; Figure 7A). In a t-test analysis, Lumen Index was found to effectively differentiate between the different metabolic states of an individual following exercise (P = 0.001; Figure 7B).

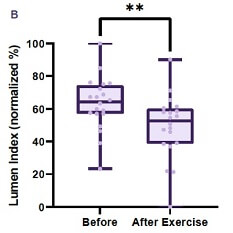
Figure 7.
(A) Lumen index change following exercise (n=20). (B) Distribution of Lumen index change following exercise. Box plot whiskers represent minimum and maximum. **P<0.01.
The above studies conclude the validity of Lumen's technology as a device that accurately measures changes in metabolic fuel usage, in a comparable manner to the gold standard. The studies concluded Lumen's ability to identify changes in the metabolic fuel usage following exercise, a change in diet and consumption of a high-carb meal.
Lumen exhibited comparable results to the gold standard as shown in the Bland-Altman plots (Figure 1). Moreover, Lumen showed similar trends to the gold standard method when measuring changes in metabolic fuel (Figure 2), and these changes were correlated between Lumen and the gold standard (Figure 3). In addition, Lumen showed test-retest reliability in different metabolic states (Figure 4).
When following a low-carb diet, the body tends to use mainly fat storages as its primary fuel source, which is represented by a low RER. However, following a high-carb meal, the body tends to use less fats for fuel, which is represented by a higher RER. Additionally, following a high-carb meal, the body tends to use available carbs in the digestive system, represented by a higher RER.
When using the Lumen device to assess changes in metabolic fuel usage, Lumen can reproduce the same trends described in the widely accepted literature. The Lumen method was found to effectively differentiate between different metabolic states of an individual (Figure 5).
Following aerobic exercise, the body shifts towards using fats for fuel. This is a well-known physiological response that has been well documented. In a t-test analysis, the Lumen method was found to effectively differentiate between different metabolic states following a single bout of exercise (Figure 7).
These controlled studies demonstrate the potential of the Lumen device to assess changes in the body’s metabolic fuel usage. The measurement results from the Lumen device were found to highly correlate with the gold standard measurement of metabolic fuel usage. In addition, the control studies demonstrate the potential of the Lumen device to assess changes in the body’s metabolic fuel usage following exercise, a change in diet, and consumption of carbohydrates.
| HR | Heart Rate |
| BPM | Beats per Minute |
| Fasting State | Following an overnight fast, the body uses the energy it needs from its energy storages, such as fat and glycogen in the liver. |
| Metabolic Cart | Form of RER or RQ measurement taken by lying down and breathing into a mask. Calculated by measuring the ratio of carbon dioxide production to oxygen consumption. |
| Lumen Levels | A Lumen Index represents the metabolic fuel source body is using for energy production. |
| Gold Standards | Respiratory Quotient (RQ) is the gold standard measurement for directly determining metabolic fuel usage that requires the insertion of a catheter into the vein and artery. |
| RER Zone | RER is the ratio between carbon dioxide production and oxygen consumption. If this ratio is between 0.7-1.0, 0.7 indicates the body is using only fats, and 1.0, only carbs. This range is divided into 7 zones. |