
Subscribe to the
Lumen newsletter.
Sign up to receive $25 off along with the latest insights about metabolic health.
Thanks for subscribing!
As a special thank you, save $20 on your order by using
20ME.


Backed by science
Trusted by researchers


Lumen’s accuracy has been validated with San Francisco State University (SFSU). This study shows the validity of Lumen to estimate metabolic fuel utilization via %CO2, in agreement with the RER measured by the “gold-standard” metabolic cart, providing real-time metabolic information for users anywhere.


Explore the cutting-edge research and peer-reviewed studies that support Lumen and its impact on metabolism.


Findings demonstrated the Lumen device detected significantly increased CO2 expiration in response to a high-carbohydrate meal, and may be useful in tracking mean weekly acute dietary carb changes.


The %CO2 measurements using the Lumen device are highly repeatable, exhibiting a good to excellent ICC reliability value. Therefore, this supports the formerly established validity of the Lumen device.


Elucidate the distinct CO2 pattern measured by the Lumen device during the different phases of the women's menstrual cycle. Additionally, CO2 changes are explored in menopausal women with and without hormonal replacement therapy (HRT).
The Lumen device detects distinct CO2 patterns across MC phases, providing insights into hormonal influences on metabolic activity. Menopausal women exhibit altered CO2 profiles in relation to the use or absence of HRT.

This retrospective study examines the postprandial CO2 response to meals logged by Lumen users and its relationship with macronutrient intake, BMI and metabolic flexibility.
This study's findings show that Lumen’s CO2 response is influenced by macronutrient consumption and BMI. The results highlight a distinct pattern of reduced metabolic flexibility in obese users, indicating the value of Lumen for assessing postprandial metabolic flexibility.

Prof. Zachary Zeigler and his team at the College of Natural Sciences at Grand Canyon University are investigating the efficacy of Lumen compared to a traditional hypocaloric diet in influencing body composition changes and arterial stiffness over a six-month RTC.
Data from 48,058 Lumen users assess the relationship between fasting hours, BMI, gender, and yesterday’s carb consumption. Higher BMI and increased age was associated with increased morning %CO₂ levels. Additionally, longer fasting durations were linked to decreased %CO₂ levels.
Currently under review.

Comparison of metabolic outcomes in women with gestational diabetes, with or without the use of the Lumen app.
Research partnerships with leading institutions in the scientific community to advance the understanding of metabolism.


Partnering with the University Hospital Schleswig-Holstein in Germany, this study focuses on metabolic changes following a very low-calorie diet.

Investigating Lumen’s potential in low-intensity exercise tests to evaluate metabolic flexibility and FatMax in both trained and untrained subjects.
Investigation of the effects of three different exercise protocols on functional capacity in early-stage burn patients at Hasan Kalyoncu University using Lumen devices to establish and measure the metabolic status of study participants.
Aerobic exercises, when added to standard treatment based on metabolic status, are more effective at improving functional capacity than standard treatment alone.
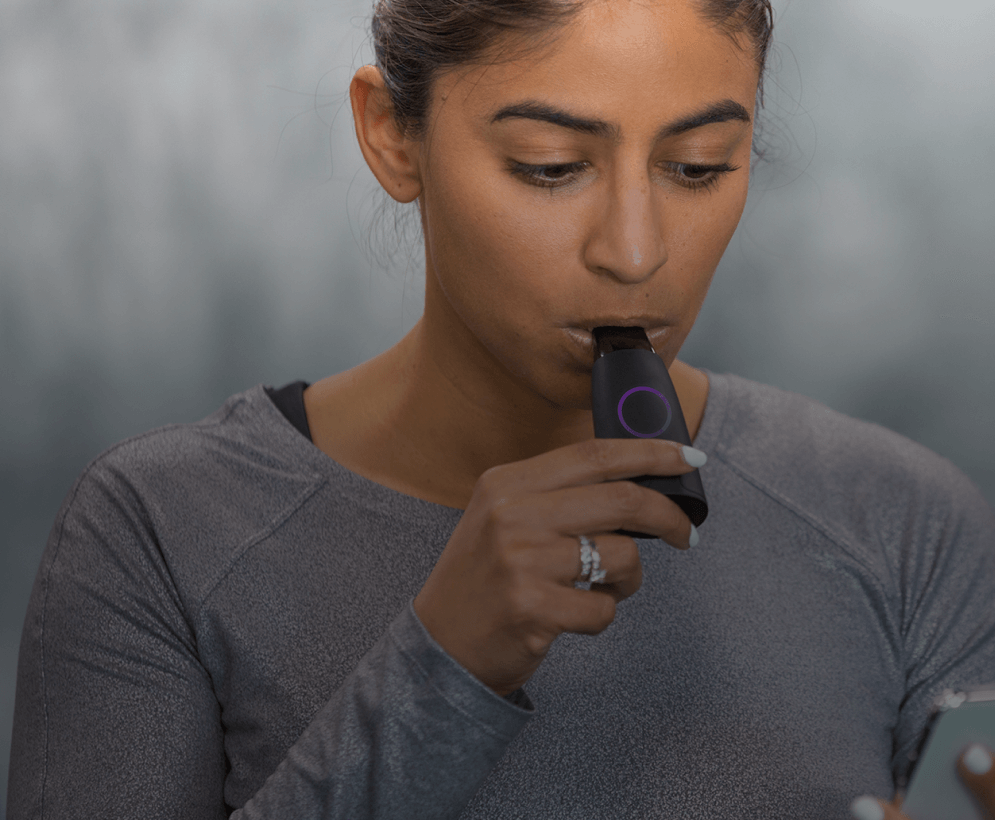
The CO2 concentration is measured using a unique breath maneuver, which is performed by inhaling a fixed volume of air through the Lumen device (dynamic to each individual), holding it for 10 seconds, and exhaling fully.
By measuring the CO2 level with the exhale flow rate, Lumen identifies the source of energy the body is using, carbs or fats.
Lumen has been validated in peer-reviewed research to match the gold standard of measuring RER.
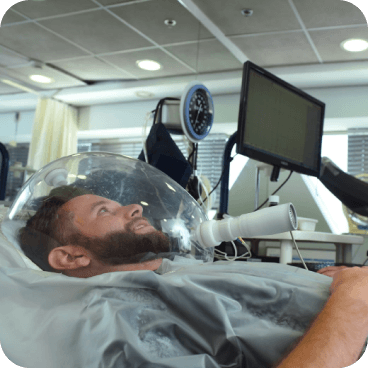

Developed by researchers, Lumen uses RER as the core data point to bring the same measurement to a home environment by measuring the CO2 in your breath through the sensor and flow meter
Unlike metabolic carts, Lumen measures breath CO2 in under 30 seconds, providing real time data.
Measurements can be taken in a lab or remotely, and results are delivered in real time through a simplified research-friendly version of the Lumen app. Data is also stored for later reference.
Lumen does not measure oxygen levels or consumption.


Use the Lumen device in your research, or do a joint research project with us